
How do Acterys Reporting, Inforiver, Profitbase, Zebra BI Table Compare?
In this blog we are covering a comparison of Financial Reporting Power BI Visuals: Acterys Reporting, Inforiver, Profitbase and Zebra BI Table. Full disclosure upfront: Managility has a relationship with one of the developers: Acterys. Still, we have aimed to compare as fair and complete as possible. If a vendor feels that anything mentioned here is incomplete or outdated please contact us and we will amend.
Why In-Visual Calculations?
Currently, the native options in Power BI for important financial reporting requirements like subtotal calculations are limited respectively not available. The only calculation option is the DAX calculations language, which typically requires more advanced knowledge and efforts and is quite processing intensive. The calculations need to be applied to the entire data set.
The Power BI visuals mentioned in this comparison all offer “in-visual” calculations that cover the typical requirements of subtotals in rows and columns in financial reports. As they only calculate the summary results in the visual they are typically much faster than DAX calculations. A reduction from minutes to seconds is often the result when moving to “in-visual” calculations.
All visuals offer similar good options here some visuals use intellisense (Inforiver, Zebra) i.e. you type the initial letters of the element that you want to use and you can then choose the one to use or a direct click on the item (similar to a cell reference in Excel (Acterys, Profitbase): Acterys and Inforiver also offer the option to use more advanced mathematical functions in addition to basic arithmetic.
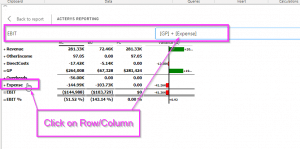 Acterys Reporting: Click on item to define calculations Acterys Reporting: Click on item to define calculations |
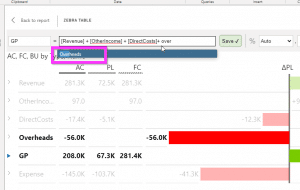 Zebra BI Table IntelliSense Zebra BI Table IntelliSense |
Formatting
Most visuals offer very extensive formatting options particularly relevant are the ones for selective row/column/formatting, under/overlines. inforiver offers an Excel like interface with a wide variety of formatting options the other visuals use the normal visual properties approach.
Editing
The Acterys and Inforiver visuals offer options for editing of data. The implementation of the write-back siffers significanly. Acterys offers a concurrent use, client server approach, Inforiver uses in-visual storage with options to synchronize results with denormalized database tables. The pros and cons of the two options are covered in depth in this post: Tips For Implementing Extended Planning & Analytics
Acterys includes all features of the platform like automated model creation for a wide variety of ERP/accounting and SaaS (e.g. Dynamics, NetSuite, Xero, QuickBooks, HubSpot, etc.). It also includes comprehensive data entry and write-back options like top down/bottom up, absolute/relative, scenario management, 3 way forecasting, table editing and in chart editing.
Most of the vendors (Acterys, Inforiver, Zebra) also offer additional Power BI visuals like: 5 Power BI visuals for planning (Matrix, Table Edit, Visual Planning, Copy) as well as Gantt for project management in Acterys. Lumel the developer of Inforiver offers a variety of visuals with their xviz offering, Zebra’s product range include Zebra Charts and a Zebra Excel-add-on.
Detailed Comparison
| Acterys Reporting | Inforiver | Profitbase | Zebra | |
|---|---|---|---|---|
| Calculations | ||||
| In-visual calculations | x | x | x | x |
| Comments | We couldn’t find a way to add a calculation at the desired position. Calculations seem to appear in arbitratry positions after being added at a particular line in our version. Other calculations can't be used in new calculations. | |||
| Calculation precedence | x | |||
| Comments | Allows you to set precedence e.g. by dragging and dropping calculations or setting precedence of row/column calcs | |||
| Formatting | ||||
| Underlines | x | x | x | |
| Sorting of columns | x | |||
| Custom Tooltips | x | x | x | |
| Styles | x | x | ||
| Conditional Formatting | x | x | x | |
| Custom Format Strings | x | x | ||
| Editing of data | x | x | ||
| Comments | x | x | x | |
| Comments | data base storage, top/down bottom up, comments | In visual storage | ||
| Chart Visualizations | x | O | ||
| Comments | Absolute/relative variance, Waterfall | Supported according to vendor but not available in public beta: Absolute/relative variance, Waterfall | Absolute/relative variance, Waterfall | |
| Other Chart Visuals included in offering | Acterys Variance (small multiples variance), Acterys Gantt, Acterys Matrix Light) | one included but Lumel the developers offers other Power BI visuals that can be purchased separately | - | Zebra Chart (Waterfalls, bars, stacked bars) |
| Pricing USD per user per month/10 user pack | $3.8 | ? | $5.2 | $4.9 |