This month Microsoft released an integration with PowerApps in Power BI. PowerApps is a great solution to build simple mobile or browser-based applications quickly. It also supports write back of data. We have been asked by some of our customers how this relates to what we do, so here is a quick comparison:
The preferred solution that Managility is working with Acterys is an integrated ecosystem for enterprise grade business modelling and planning that seamlessly integrates with the market leading data discovery solution Power BI and Excel/Excel Online. The heart of our system is an OLAP engine which runs on a relational database (SQL Server on premise or on Azure) that enables in-memory processing of the relational tables. A typical standard relational, disk based approach used by other tools on the market can’t cater for processing large scale multi user write back.
The Acterys engine automatically generates optimal data warehouse structures either based on our connectors (cloud-based accounting systems like Xero, QuickBooks online, Saasu etc.) or completely from scratch when users build their own dimensions and cubes as required (e.g. by copy and paste from Excel) or by importing data via ETL (SQL SSIS).
PowerApps is a great solution to collect a few specific numbers/KPI’s on the base level and add as records to a database. If that’s all you require perfect. We often use it alongside Acterys for simple data collection, but typically the main requirements in planning and forecasting situations are normally very different:
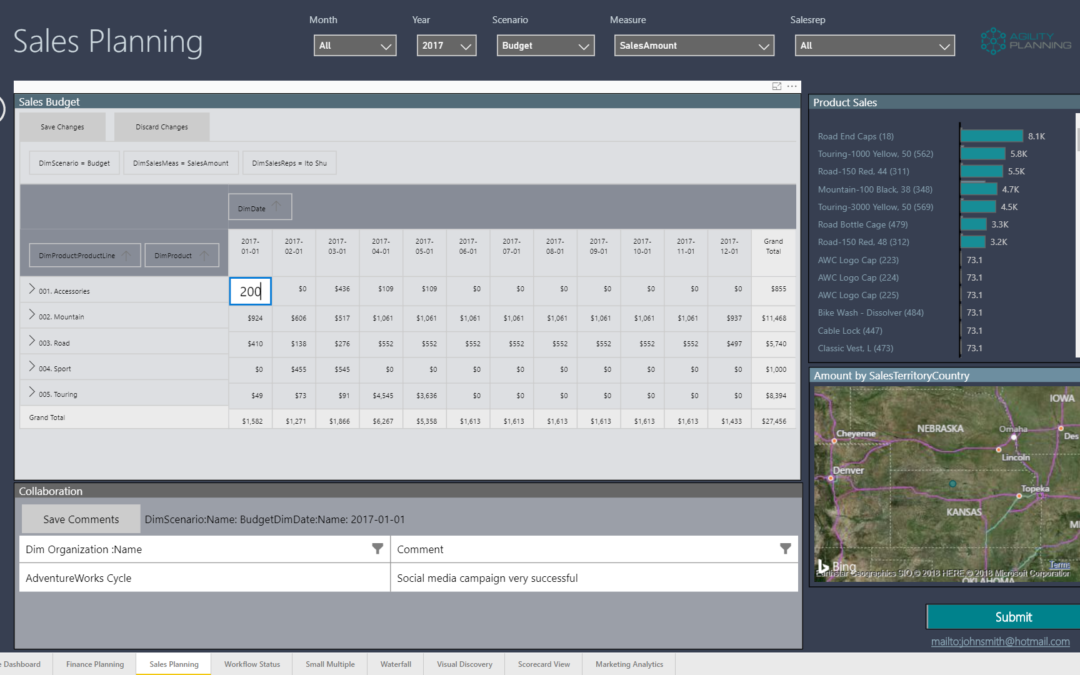
In the planning process, users are dealing with complex data models that include among others: financials, sales, HR details , etc. as well as sophisticated calculation logic. Manipulation of these requires effective (including the support of special financial report structures) tabular entry and the option of entering data on different hierarchy levels. The users need to immediately see the effects of entries and changes in a tabular structure. All this is impossible in PowerApps.
In the following table I have put together an overview of how the different options to enter data in Power BI differ:
|
Feature |
Acterys |
PowerApps |
Other Write Back Tools |
Getting Started |
|||
|
Initiation |
Cloud based self-service sign on/ billing | Download of an App or web service | Manual purchase from vendors (no self-service checkout) |
Back end |
|||
|
Automatically generating optimal data |
ü | × |
× |
|
Processing write back/model changes in |
ü |
× |
× |
|
Connectors to cloud-based accounting |
ü | × |
× |
|
Audit trail that tracks all changes |
ü |
× |
× |
|
AAD B2B support, single sign on |
ü | ü | ~ |
Front ends |
|||
|
Modelling |
|
Limited, respectively require add-in install. |
|
Write Back |
|||
|
Data Entry on Pivot Tables and Power BI visual |
ü | × |
ü |
|
“Splashing”/data entry on any level of the dimensional hierarchy |
ü | × |
ü |
|
Copy Wizard for data manipulation |
ü |
× |
~ |
|
Write back on Excel report formulas in addition to Pivot Table |
ü | × |
× |
|
Comments |
ü |
× |
ü |
For further details on how the solutions compare and how Acterys can assist your business modelling and planning processes please contact our friendly chat team.